Histograms are the most accurate representation of the exposure of your photograph. At least, up to a certain point. With that, if you learn how to read a histogram, you will always know whether you are underexposing or overexposing your photo. Since it is a data-driven tool, it is always accurate and not affected by external factors.
If you were to judge the exposure by the screen of your camera, and you have the LCD brightness set a bit high, you might think that your photos are brighter than they actually are. In other words, the LCD screen is good for judging composition, while the histogram is good for judging exposure.
What Is A Histogram?
Simply put, a histogram is a graph that plots the brightness of the pixels in the photo. Horizontally, the histogram represents pixel brightness, while vertically, it represents the number of pixels for a given brightness level. That said, the histogram shows you how many pixels you have for each brightness level.
It is a tool that reads the pixels as they are and plots every single pixel on the graph. It is a completely data-driven tool.
However, you should know that the histogram always pulls the data from a rendered JPEG, be it a preview or a file). It does not take RAW data into account.
How To Read A Histogram?
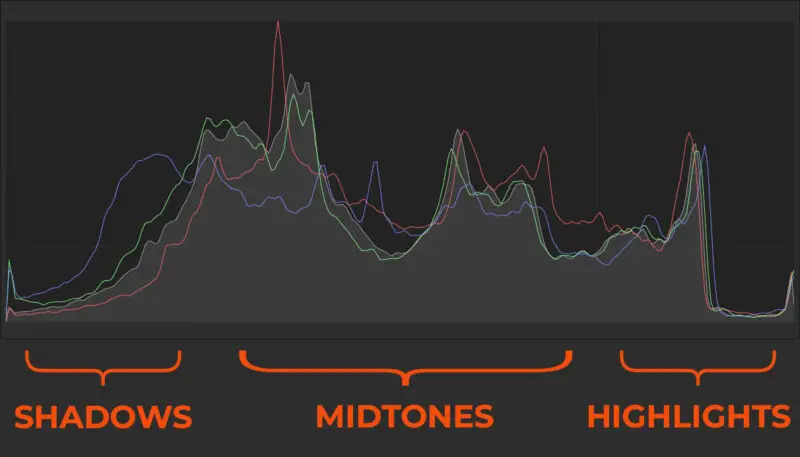
As previously mentioned, a histogram is merely a graph plotting out the number of pixels for a given brightness value. On the left side of the histograms, you will find the shadows, while on the right side of the histograms, you will find the highlights. The mid-tones are in the middle.
The higher the graph in a given range, the more pixels the image has with that brightness. So if the graph is positioned mostly in the mid-tones, it means most of the photo is exposed correctly.
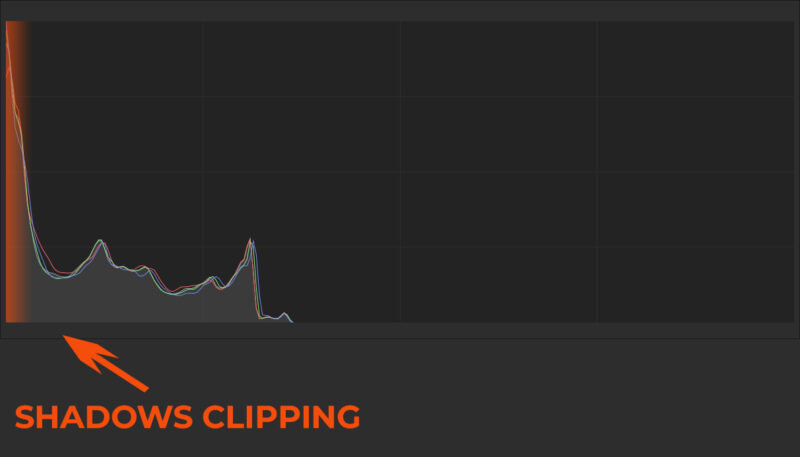
Let’s say your image is severely underexposed you will notice that the histogram will be showing the data clumped along the left side. That means that the brightness of all the pixels is on average dark or completely black.
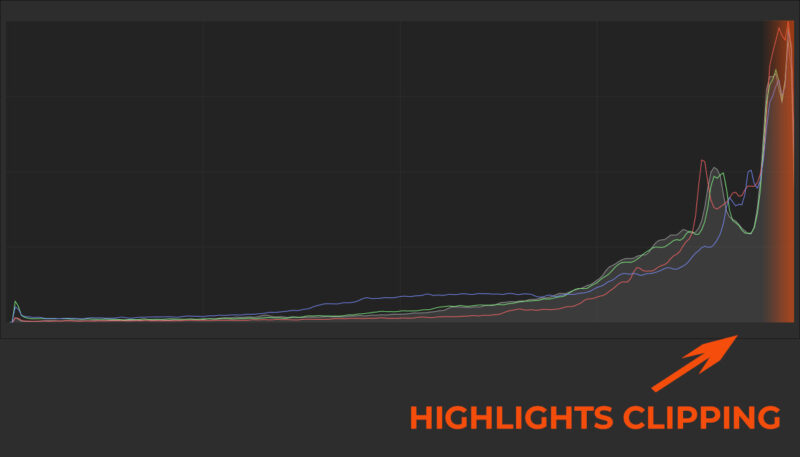
When your image is severely overexposed, the opposite will happen: the histogram will clump along the right side.
If you have pixels that are on the edges of the left or the right side, you have clipping. That means that you have pixels that are too bright or too dark, and they will look completely white or completely black. In this case, you are losing details in the highlights or shadows.
The goal is to aim for exposure where most of the data is towards the middle of the histogram so you can avoid any clipping.
How To Read A Histogram And Determine Contrast?
Even though you will be using the histogram to determine the correct exposure most of the time, you can also use it to determine the contrast.
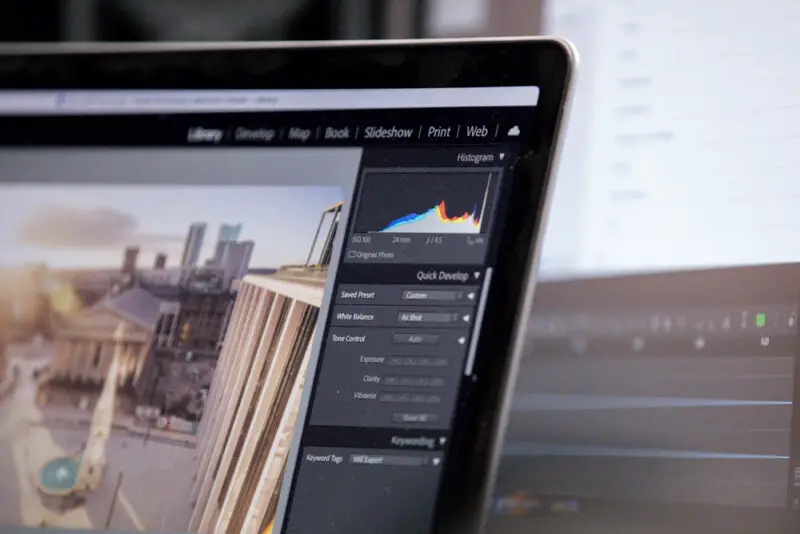
Determining contrast by using the histogram will be more accurate in your editing software than in your camera. But even with your camera, you can get a rough idea about the contrast of the photo, especially if you are using a neutral or flat picture profile.
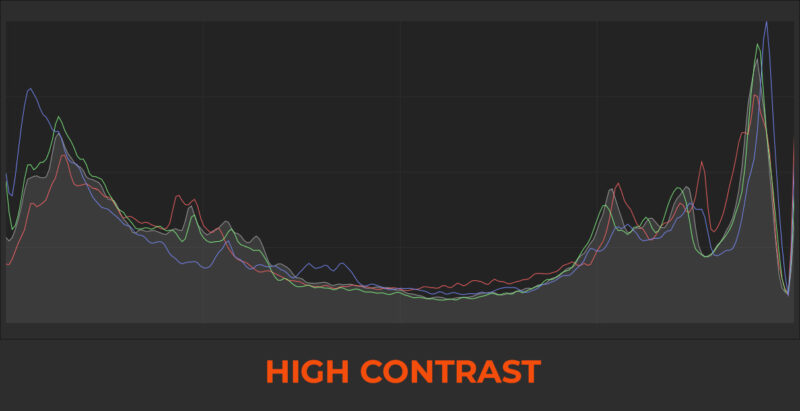
In a high contrast scene, you will notice that the histogram will be split into two chunks, both nearing the edges of the photo. In other words, most of the pixels will be either dark or bright. There will be a small number of pixels gravitating towards the mid-tones.
A histogram of a high contrast photo looks something like this:
Notice the spikes around the shadows and highlights, but there is a dip in the graph around the mid-tone range. That means that the photo has high contrast. Judging by this histogram, the contrast is so high that there are shadows and highlights clipping. Not good.
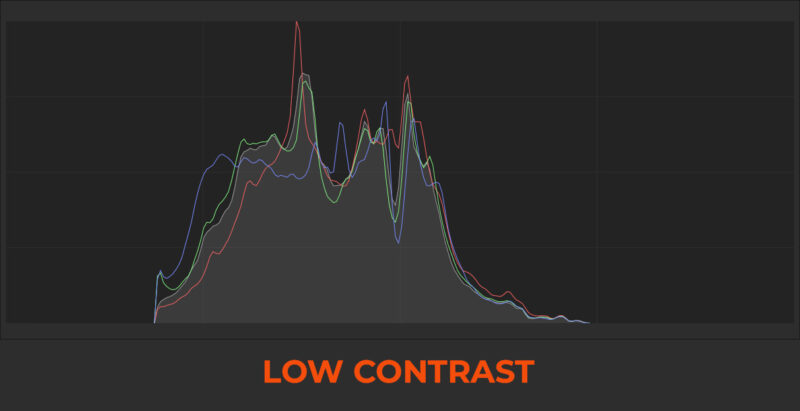
Inversely, a low contrast scene will produce a histogram with the graph clumped in the middle, where the mid-tones are. In this case, most of the pixels are near the mid-tones, and there are no highlights and shadows to provide contrast. Thus, you have a low contrast photo.
That might be good for you to work your magic in post-production, but it can also mean a dull photo where everything is flat.
Are All Histograms The Same?
The short answer is no. The long answer is, in essence, yes, but the histograms differ by the data they show. Histograms, by nature, are tools that show the data they have as input, so in theory, you can have all sorts of histograms for photography. However, two main types are most common, three if you count the combination of the two.
You will find two types of histograms in your camera and your editing software. One will be luminance, and the other will be RGB. Sometimes you’ll find a combined one that will show the luminance and the RGB channels at the same time.
What Is A Luminance Histogram?
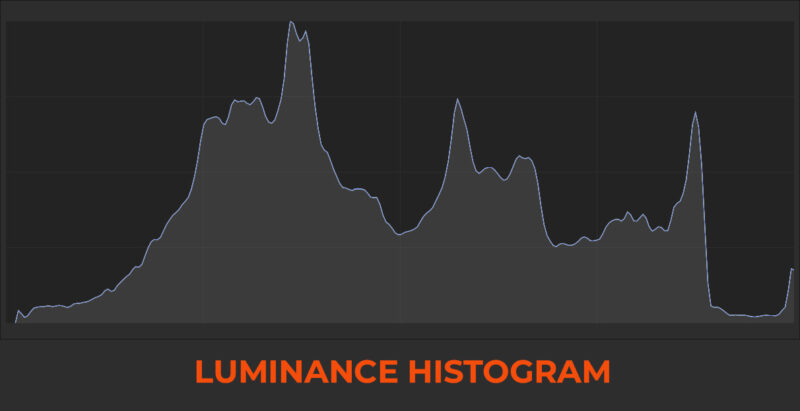
Luminance histogram is the most common histogram you will encounter. It simply cares about brightness disregarding color.
It is more than enough to judge exposure as it is still accurate, but it is accurate to the point where you do not care about separate colors. In essence, it sums up the RGB values of the pixels and represents them as if it was a monochrome photo.
With a luminance histogram, you will not know which channel clips. But you will know if any clipping occurs.
The luminance histogram is a good histogram to have on your display or EVF. It is not too distracting and yet provides enough information for you to judge your exposure correctly.
There are two types of luminance histograms, one that disregards color and shows only the brightness value, and the other which sums up the RGB channels into one and shows them without representing each color.
In essence, they are quite different. However, in practice, you can use either one to judge exposure. Both will show clipping, even though the RGB sum one has three times more data since it counts each color channel (subpixel) as a single pixel, whereas the luminance one counts RGB sub-pixels as one pixel.
What Is An RGB Histogram?
Camera sensors, displays, and digital photos in general consist of pixels. Each pixel of the sensor in your camera consists of 4 sub-pixels: one red, one blue, and two green pixels. A color digital image has three channels: red, green, and blue.
An RGB histogram shows the brightness of the red, green, and blue subpixels or channels separately in your camera or editing software. That means you essentially have three separate histograms merged into one for each subpixel or channel color.
That gives you a better understanding of color balance along with exposure. With an RGB histogram, you can see whether your exposure is correct and if your color temperature is balanced.
You can also see if one channel clips or not. That is especially important with the blue channel, for example, if you shoot landscapes with a lot of sky in the frame. The image might not look overexposed, but if the blue channel is clipped, you will have a hard time recovering details there.
Of course, that also applies to any image where you have a dominating color. If any of the channels clip, you are losing detail in that color range, which can cause banding or weird color shifts.
Is The Histogram Always Accurate?
In essence, yes. However, the histogram is limited to the data it sees. For example, for video, the histogram is quite accurate because what you see on the screen is what you get. There is rarely extra data baked in the file that the histogram does not see, even though most videographers will use a waveform instead of a histogram for better accuracy.
In photography, the histogram is usually limited to a smaller data set compared to what you can actually have. That makes it inaccurate because you won’t know how much data is left to recover the lost details outside the scope of the histogram.
In other words, if you follow the histogram, you will be safe all the time, but you might be leaving some dynamic range on the table.
So The Histogram Does Not Read RAW Data?
When you shoot photos, the histogram is limited to the JPEG preview, and it is dependent on the picture profile you set on the camera. So if you shoot RAW and have a contrasty picture profile, the histogram will read the contrasty preview and display the data for that.
In other words, the histogram is limited to the 8-bit JPEG preview and the picture profile you have set in the camera.
However, the RAW file has much more data in the shadows and highlights that the histogram cannot see. That means that you will have to test out what is the actual clipping point for the highlights and shadows of your camera, so you can know how much you can recover them past the maximum of the histogram.
For example, I can recover almost two stops overexposed on my 7D Mark II, but on my 6D, the limit is around 1 stop. I can recover almost 2 stops in the shadows on my 6D and around 1 stop on my 7D Mark II. Both cameras have a similar dynamic range, but it recovers differently.
That said, for best results, you should keep your exposure within the histogram limits. That way, you do not risk losing details due to failed recovery. Of course, for best noise performance, keep the exposure to the right as much as possible but avoid clipping. If you darken the image in post-production, you do not lose anything. Brightening it up will get you more noise.
If you do not know by now, clipping means that you have parts of the photo that are either too bright or too dark to be recovered. So they appear as pure white or pure black spots with no details left there.
What Is JPEG Preview?
Even when you shoot RAW without a JPEG file, the camera display shows you a JPEG preview, even though it does not save it. That means that the back screen or the EVF always shows a JPEG with a picture profile baked in, even though the RAW file is unaffected by picture profiles.
The camera has to do that since the RAW file is not a picture, at least not yet. In other words, the camera needs to process the RAW file in a certain manner so you can see it. It does this by creating a JPEG preview for you.
That affects what the histogram shows since it shows data gathered from the JPEG preview.
In your camera settings, you will find picture profiles like Neutral, Portrait, Faithful, Landscape, Monochrome, etc. On Fuji cameras, they are called film simulations. Most cameras allow you to tweak these picture profiles.
If The Histogram Uses JPEG Preview, How Can It Be Accurate?
Even though the histogram is limited to the JPEG preview and the picture profile of the camera, it is accurate if you know how to use it. If you keep your exposure within the histogram of the JPEG preview, you are completely safe from clipping. The RAW file has a lot more leeway than the JPEG has.
The trick is how far out of the histogram you can go without losing precious data and having a photo without any important areas end up clipped.
Well, it boils down to some testing and fiddling, but the good part is that you need to do this once. As previously mentioned, different cameras have different sensors, and with that, your ability to recover details will differ.
You can only do a certain amount of recovery on a given camera sensor. Therefore you need to figure out how much you can recover your RAW files.
How Do I Know How Much I Can Recover Past The Histogram Scope?
The easiest way to figure out the amount of recovery you can perform on your RAW files is to test it out.
First of all, find a neutral picture profile. Make sure that you are using that picture profile all the time. In other words, use a picture profile with the brightness, contrast, and saturation set to 0. You can change the sharpness value to whatever looks best for you. I usually have it a bit increased so I can check focus easily.
Then, find a high contrast scene that has constant light. A dimly lit room with a TV that displays a fixed photo is usually good enough.
Next, set your camera on a tripod, and focus on the TV. The focus does not have to be perfect. Set the ISO to 100 and open up the aperture all the way. Now, adjust your shutter speed until you can barely see anything in the photo. That is your starting exposure. Take the first photo.
Now reduce the shutter speed by a third of a stop (one click on the wheel), and take another photo. This one should be a bit brighter than the previous one. Repeat this process until you get a completely white photo.
Since cameras lose dynamic range as you increase the ISO, you will also need to test that out. Repeat the same test for ISO 400, ISO 1600, and ISO 6400.
How Do I Test Out The Recovery?
Load all the RAW files in Lightroom or Capture One.
In each set of photos (separated by the ISO number), find the photo with the correct exposure. Using the Exposure slider, try to brighten or darken the photos to match the correctly exposed one. Do not worry if they look all noisy. The important thing is for all of them to be equally bright.
Each photo should be roughly 0.33EV apart. You should start brightening the photos that are darker than the correct one in increments of 0.33EV. So the first one to the left should get +0.33 EV on the exposure slider, the next one should get +0.67 EV, then the third one should get +1 EV.
Inversely for the photos that are brighter than the correct exposure, start reducing the exposure in 0.33EV increments.
On the bright photos, reduce the highlights by 75, and on the dark photos, increase the shadows by 75.
Now, observe the dark photos. Regardless of the recovery, which photo starts losing shadow details? Read the amount of exposure you have added. For example, it is +2EV. That means you can underexpose by 2EV and still be able to recover the shadows. To be safe, you should avoid underexposing more than 1.5 EV.
Now take a look at the bright photos. Find the photo that has the most details in the highlights. That is your highlight recovery limit. Read the exposure value. Let’s say that is -1.5EV. That means you can overexpose by 1.5EV and still have recoverable highlights. To be safe, you should avoid overexposing more than 1EV in this case.
The rule of thumb is to leave at least 0.5EV of room just to be safe.
How To Read A Histogram And Use It For ETTR
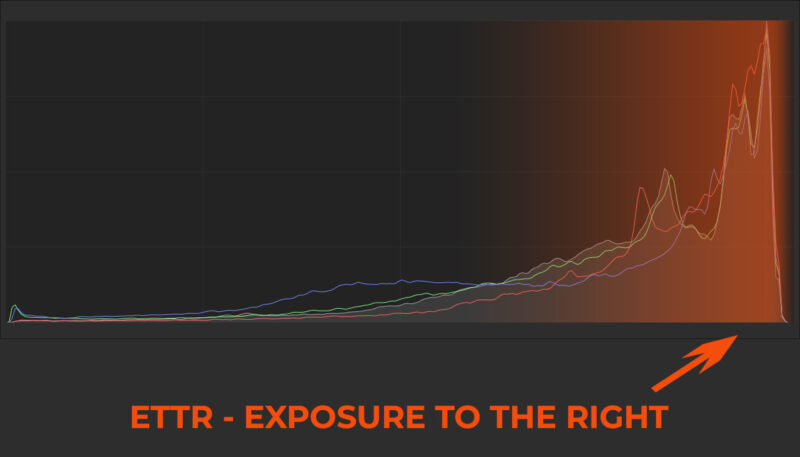
ETTR, or exposure to the right, means that you slightly overexpose the photo to push the data to the right side of the histogram while still avoiding clipping. That is a technique that photographers use with older sensors that have a higher noise floor.
You can also see this technique utilized with astrophotographers who want to gather as much detail in the night sky as possible. Thus they resort to different techniques in combination, ETTR and Image Stacking being the most important.
The common misconception is that high ISO is the culprit for higher noise. However, the amount of noise is generally dictated by something called a signal-to-noise ratio.
The signal, in this case, is the amount of light, while a sensor without light will only produce noise. So a signal-to-noise ratio that leans more toward the signal side will result in a less noisy photo.
ETTR aims to do just that. You overexpose a photo as much as possible without clipping, and with that, you get a cleaner photo. If you compare an underexposed ISO 400 image and ETTR ISO 1600 image, the latter will often have less noise.
Of course, you will have to correct the overexposed photo in post-production.
Conclusion
A histogram is a data-driven tool and it is limited by the data available. It helps you determine the exposure by showing you the data from the JPEG preview on your camera or the visible pixels in your editing software.
The histogram will never show you data it does not see. In other words, it will not help you know how much you can recover your RAW file. Nothing stops you from testing out how much you can recover past the scope of the histogram and using the histogram as a tool to judge whether you are past the point of recovery.
If you stay within the histogram scope, you will not lose any highlight or shadow detail. However, you might be leaving dynamic range on the table.
The histogram can also help you judge the contrast. In other words, if the histogram shows fewer data in the middle and most of the data is along the edges, that is a high contrast photo. If it is the other way around, then you are looking at a low contrast photo.
Moreover, in an RGB histogram, you can see whether the individual channels are clipping, which can be useful if you shoot scenes that have one dominant color, like a blue sky.
So, use the histogram as much as you can as it is the only tool that will allow you to have correct exposures consistently.


